
The ProfessionalInvestment PlatformInside Excel
Live market data, stock screening, options analytics and portfolio management inside Excel, trusted for over ten years by analysts, advisors and asset managers.
Real-time
Live market data streams straight into your Excel models.
Enterprise-grade
Trusted by investment managers, RIAs, analysts and pro option traders.
Expert Help
Priority access to our expert team, 24/7 by phone or live chat.









.svg)


Hundreds of Asset Managers Run Multi-Asset Portfolios in Excel. Here's How.
Enterprise-grade data and analytics in the tool your team already knows. No migration. No retraining.
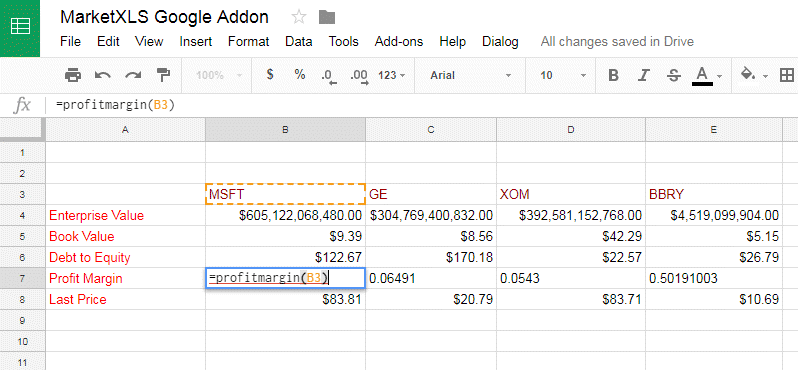
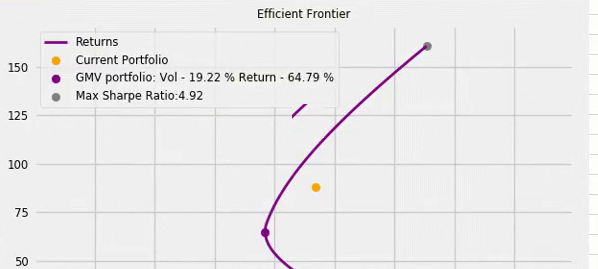

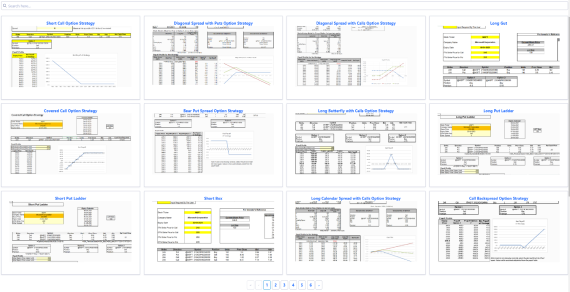
Fanatical Personal Service & Community Support
12 hours
500+
97
Some of our users are a part of these organizations









Customer Spotlight

Manual data entry from websites. Tedious, time-consuming, outdated the moment it was finished.
Professional 3-monitor setup with real-time data, option grids, and automated cash flow calculations.
Our Clients
 1/2
1/2

Book a demo with our team to explore the features and workflows relevant to your research.
See what else MarketXLS has to offer

Filter out stocks that meet your criteria
Scan the option chain and track the payoff for the selected option
Get access to all information on a stock at one place

Stop Guessing. Start Knowing.
The web platform for ETF & Mutual Fund research. See exactly what you own, where you're overlapping, and which funds actually deserve your money.
Choose your next step in MarketXLS
Start with the workflow that matches what you want to build in Excel.
- Learn
Learn with practical Excel guides
Browse step-by-step market-data, investing, options, and portfolio workflows for Excel.
- Learn
Browse the Excel formula reference
Find documented functions, syntax, and examples for building your own analysis.
- Use
Start from an Excel template
Use a ready-made workbook when you do not want to begin with a blank spreadsheet.
- Use
Build a custom stock screen
Filter the market with your own criteria, then continue the research in Excel.