Make investments better with MarketXLS
Learn through our numerous blogs
Search for a blog
Categories
1042
424
242
223
144
138
94
67
32
11
2
Real-time Option Greeks functions - New Release 9.3.6
by Shubham Shah
Real-time Option Greeks functions - New Release 9.3.6
We hope you are doing well. With great excitement, we announce the release of MarketXLS Version 9.3.6 today (May 10th, 2024). This latest version has the following updates.
1. Custom Real-time / EOD Greeks for Options
In our latest 9.3.5 update, we introduced new 'opt' functions for option traders (details on our blog). We've added customizable Real-time Option Greeks functions to this series, enabling you to conduct 'what-if' scenarios. These scenarios allow you to explore how Greeks would adjust if variables like price or risk-free rate changed, helping you assess how sensitive an option's price is to changes in the underlying stock price.
These function's calculates the Greeks of an option based on your inputs.
1) CurrentStockPrice: Input the current price of the underlying stock.
2) MarketOptionPrice: Enter the current market price of the option.
3) ExpiryDate: Specify the expiry date of the option.
4) OptionType: Choose the type of option you are analyzing. Options include: "Call" for call options,"Put" for put options.
5) StrikePrice: Input the strike price of the option you are evaluating.
6) Risk Free Rate: The default rate is set to 4%, but it can be changed as the user wants.
Example: =opt_Delta(420,12,"09-05-2024","Call",4%)
List of Functions:=opt_Delta("CurrentStockPrice","MarketOptionPrice","ExpiryDate","OptionType","RiskFreeRate")
=opt_Gamma("CurrentStockPrice","MarketOptionPrice","ExpiryDate","OptionType","RiskFreeRate")
=opt_Theta("CurrentStockPrice","MarketOptionPrice","ExpiryDate","OptionType","RiskFreeRate")
=opt_Vega("CurrentStockPrice","MarketOptionPrice","ExpiryDate","OptionType","RiskFreeRate")
=opt_Rho("CurrentStockPrice","MarketOptionPrice","ExpiryDate","OptionType","RiskFreeRate")
=opt_ImpliedVolatility("CurrentStockPrice","MarketOptionPrice",
"ExpiryDate","OptionType","RiskFreeRate")
2. Previous Earning
MarketXLS vs. ThinkOrSwim Excel Streaming Data
by admin
Feature
MarketXLS
ThinkOrSwim
Independence from Trading Platforms
Operates independently of trading platforms.
Requires the platform to be open.
Advanced Trading Functions
Generate trade tickets for complex strategies to submit to ThinkOrSwim
Limited to real-time data streaming.
Real-Time Intelligence
Real-time RSI, SMA, and technical indicators.
No technical indicators within Excel.
Historical Data and Option Chains (Tabular data)
MarketXLS returns tabular data of various needs. Historical, Option Chain, Option Filtering and many more
Limited to real-time data streaming.
Customizable Real-Time Greeks
User-defined real-time Greeks.
Pre-calculated Greeks only.
Advanced Key Ratios
Access advanced key ratios and metrics.
Focused on real-time data.
Advanced Option Trading Functions
Functions for current at-the-money strikes and expirations.
Limited options data.
Comprehensive Research
Extensive research and analysis tools. Stock return function, Volatility function, Portfolio Analytics functions
Focused on real-time data streaming.
Financial Functions
Hundreds of financial functions. Data comes from MorningStar
Limited to real-time data streaming.
Support
MarketXLS provides personalized support, hand holding, spreadsheet guidance
Limited to real-time data streaming.
How To Read An Option Chain?
by Shubham Shah
Table of contentsWhat Is An Option?What Is An Option Chain?Key Elements Of An Option ChainUnderlying AssetStrike PriceExpiration DatesBid and Ask PricesOption Type In Option ChainOption SymbolsVolume and Open InterestWhat Are Option Greeks?Importance Of An Option Chain For TradersAccess To Option ContractFaster TradeAccess To All ExpiresPrice DiscoveryLiquidity AssessmentSignificance Of Option ChainSummaryLearn More About
What Is An Option?
Options trading has surged in popularity recently, but many traders face losses due to insufficient understanding of these derivatives. It's crucial never to trade options without proper knowledge.
An option, as a derivative, derives its value from an underlying instrument such as stocks, currencies, indices, commodities, or other securities. Options grant the purchaser the choice, without obligation, to execute a transaction involving an underlying asset at a predefined price on a specified future date.
While options trading can yield high rewards, understanding their complexities is crucial.
What Is An Option Chain?
An Option Chain offers a comprehensive overview of option strikes for a specific stock or index. In this display, strike prices are centered, with call and put data aligned on the left and right sides. This setup not only presents price and volume information but also includes analytical details like changes in OI and IV.
The option chain also features the current market price and build-up data to indicate market trends based on recent shifts in OI and price. Additionally, it highlights ITM call options in yellow to aid traders in quickly identifying key trading opportunities. This tool is essential for investors in the National Stock Exchange who need to make swift and informed decisions in the fast-paced market environment.
Key Elements Of An Option Chain
Underlying Asset
This refers to the security on which the options in the chain are based. It could be a stock, index, ETF, or
Get Nifty futures live data in Excel (With MarketXLS)
by admin
stock exchange
Table of ContentsWhat is Nifty Futures?What is the difference between NIFTY 50 and NIFTY 50 futures?How do you get live Nifty futures data in Excel?Summary
Master the dynamics of the Indian stock market! Dive into our comprehensive guide outlining Nifty Futures and how to perceive live Nifty Futures data for keen investment decisions.
What is Nifty Futures?
Nifty Futures is a financial instrument traded on the National Stock Exchange of India. It is a derivative contract based on the Nifty 50 index. This contract allows investors to buy or sell the index at a preset price for delivery on a future date. It is used for hedging and speculative trading. The price of Nifty Futures is driven by the Nifty 50 index value. Thus, any changes in the index directly impact the futures price. It helps investors predict the market's direction and make informed decisions.
What is the difference between NIFTY 50 and NIFTY 50 futures?
NIFTY 50 is India's primary stock index that represents 50 of the largest and most liquid Indian companies traded in National Stock Exchange (NSE). It works on a weighted average market capitalization method. On the other hand, NIFTY 50 Futures are derivative contracts, reflecting the probable future value of NIFTY 50. These contracts allow investors to buy or sell the NIFTY 50 index at a predetermined price for a specified period. So, while NIFTY 50 represents the current market status, NIFTY 50 futures indicate the anticipated market performance.
How do you get live Nifty futures data in Excel?
The MarketXLS formula "=FuturesSymbol("Underlying","Expiry Date")" is a useful tool to generate a futures symbol. After creating the symbol, apply "=zerodhaLast(Futures Symbol)" to extract the price of the future in Excel. Remember, a connection between your MarketXLS and Zerodha is mandatory. As soon as the markets open, data will automatically stream into your Excel.
Summary
Nifty Futures is a financial
Excel stock price on specific date function (MarketXLS)
by admin
Dive into understanding how to extract a specific date's share price in Excel in a jiffy, using simple functions such as STOCKHISTORY or MarketXLS Historical Functions. The data from Excel and the MarketXLS plug-in offers fascinating insights even if the chosen date was a stock market holiday!
How to get specific date stock price in Excel?
To get a specific date's stock price in Excel, you'll need the stock's ticker symbol. Use the "STOCKHISTORY" function. Start by typing "=STOCKHISTORY(" in a cell. Then, input the ticker symbol in quotation marks, followed by the date you want in the format "YYYYMMDD". It should look like this "=STOCKHISTORY("AAPL", 20200101)". Press "Enter" and Excel will display the stock price on that specific date.
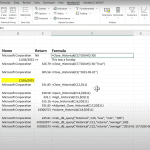
MarketXLS Historical Functions
When using MarketXLS, you can access historical stock market data easily through commands like Open Historical, Close Historical, High Historical, and Volume Historical. All that's needed is the stock ticker name. For instance, if you need details about Microsoft's closing price on May 2, 2024, the command would be =Close_Historical("MSFT","2024-05-02"). Also, flexibility is provided as the date can be a cell holding the desired date. This makes data analysis on MarketXLS user-friendly and efficient.
What if the date was a stock market holiday?
MarketXLS Close_Historical functions offer flexible handling of stock market holidays. This function accepts additional arguments and specific instructions on how to manage such dates. You can use the "Include Holidays" argument and set it to True. If done, the formula computes results based on the final price from the previous trading session. By default, the function will showcase an "NA". This indicates that the specified date was a market holiday. Hence, this function allows users to manage non-trading days effectively.
See the Video below.
The video below show the historical functions of MarketXLS.
Relative historical
NSE option chain data in Excel (with MarketXLS
by admin
Organize NSE option chain data in Excel
MarketXLS is an essential tool for investors, providing templates that enable you to connect directly with your brokers to obtain live-streamed NSE option chain data in Excel. This dynamic feature lets you track and analyze financial information in real-time, helping to guide immediate and informed investment decisions. MarketXLS allows users to tap into significant financial data which, combined with the analytical power of Excel, provides key insights to determine investment potential and track market fluctuations more effectively. This task is crucial to successful investment strategies to help monitor, evaluate and act upon viable financial opportunities swiftly.
Benefits of using Excel to organize NSE option chain
Using Excel to organize NSE option chain data offers several benefits. It helps in efficient data management. You can categorize, sort and filter data quickly. Excel also has advanced tools for data analysis. You can apply mathematical and statistical calculations to the data. It not only enables us to create customized charts and graphs, but also aids in better data visualization. Importantly, Excel improves accuracy in forecasts. It provides built-in features for trend analysis and predictions. Furthermore, sharing data becomes much easier. It supports exporting data to various other formats. Overall, Excel enhances decision making by providing clear insights into patterns and trends in the data.
MarketXLS RTI Functions
MarketXLS offers a host of functions known as =RTI functions. These make live streaming of option chains and real-time analysis easy. The analysis yields multiple data types. Quick filtering of options to suit your criteria is its best feature. Real-time greeks, prices and technical indicators are streamed. This includes RSI, Volumes, PCR Ratios and more. With these functions, you will always have the data you need at your fingertips.
Analyse NSE option chain in Excel
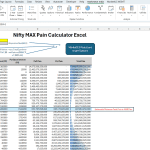
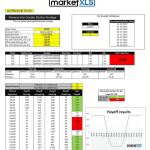
Bank Nifty max pain - in Excel
by admin
Table of ContentsWhat is Max pain?How max pain helps option buyers and sellers?Max pain in context of Option BuyersMax pain in context of Option SellersWhat is Max pain point? How do you calculate Max Pain?How to use MarketXLS to calculate MAX pain of Bank Nifty?Summary
Let's dive into the world of options trading and learn about max pain, which is a significant deal for traders. Max pain helps traders decide what to do by showing them where the most losses might happen. We'll see how max pain can help traders make smarter choices in the complicated market. We'll also find out how to figure out max pain for Bank Nifty using MarketXLS, a handy tool that makes analyzing easier and helps improve trading strategies. With MarketXLS, you can make better decisions and increase your chances of success in options trading.
What is Max pain?
"Max pain" is a commonly discussed concept in the domain of options trading. It represents the price level where options traders collectively face the greatest potential financial loss or "pain." This moves to the strike price where, upon expiration, the stock price would inflict maximum losses on option holders. Referred to as the "maximum pain point" or "maximum option pain," this notion stems from the observation that stocks tend to gravitate towards this particular strike price on expiration day, thereby minimizing the value of options. While not a definitive theory or model, traders often utilize max pain as a predictive tool, though its accuracy is not guaranteed. Max pain aids both buyers and sellers in decision-making regarding their options positions.
How max pain helps option buyers and sellers?
Option buyers aim for the stock price to move in a direction that allows them to profit upon exercising their options. Conversely, option sellers prefer the stock price to remain distant from the strike price of the options they've sold, enabling them to retain the premium received from the sale.
Max pain in context
Option Strategy for Beginners - Top 10
by Shubham Shah
Table of contents1. Covered call/ Naked Call Option Strategy2. Bull- Call Spread Option Strategy3. Protective Put Option Strategy4. Bear- Put Spread5. Strip Option Strategy6. Iron Condor Option Strategy7. Long Straddle and Short Straddle8. Long Strangle and Short Strangle9. Momentum Option Strategy10. Scalping Option StrategySummaryLearn More About:
Discover the ultimate option strategy, perfect for beginners. With these proven techniques, you can confidently navigate the world of options trading and make profitable decisions. Don't miss the opportunity to take your investment game to the next level—try these strategies today!
Here are the top 10 options trading strategies for new learners:
1. Covered call/ Naked Call Option Strategy
Two of the few popular strategies are the Naked call option and the Covered call or buy-write. With the naked call option, you buy the option to purchase a stock at a future date. A covered call involves owning the stock and selling a call option, generating income, and reducing some risks.
2. Bull- Call Spread Option Strategy
Bull-Call Spread is a trading strategy where you buy an ATM call option and sell an Out-Of-The-Money call option on the same asset with the same expiration date. It is profitable when the asset's price goes up but there may be losses if the stock price falls.
3. Protective Put Option Strategy
In a Protective Put, an investor buys an asset, such as shares of stock, and buys put options for an equal number of shares. A put option gives the holder the right to sell the stock at a specific price, known as the strike price. Each contract represents 100 shares. This approach can protect the investor against potential losses when holding the stock and It works similarly to an insurance policy, creating a price floor in case the stock's value drops significantly.
4. Bear- Put Spread
The Bull Put Spread, a type of Credit Spread, is used by traders expecting a moderate rise in the underlying
NSE Option Chain Excel: Nifty, BankNifty, FinNifty & more...
by Shubham Shah
Table of contentsHow can I use MarketXLS to get NSE Option Chain?Setting up MarketXLS for NSE Option ChainNSE Option Chain TemplateKey Features:Summary
Enhance your trading experience by accessing the NSE Option Chain and stock data right on your Excel, with MarketXLS, a comprehensive tool integrated with Morningstar™ and NSExchange.
How can I use MarketXLS to get NSE Option Chain?
MarketXLS's primary goal is to provide timely updates to traders' analytical models. Excel is our primary tool due to its ease of use and efficiency. We boost user experience by integrating comprehensive data from Morningstar™ and NSExchange. Included are various algorithms and templates. This has positioned MarketXLS™ as a vital tool for professional and retail traders. Users can get a real-time view of NSE option chains and stock data using the MarketXLS template. It is available at www.marketxls.com/marektxls-templates. We currently support AngelOne and Zerodha for real-time integration.
Setting up MarketXLS for NSE Option Chain
Setting up MarketXLS for Excel is straightforward. Users can follow the instructions provided in the setup email to download and install the software within Excel.
Once installed, navigate to the MarketXLS ribbon, select the Settings/Help dropdown, and click on "Apply License" to enter the license key received in the setup email. Specific instructions vary for connecting to brokers like Zerodha and AngelOne, so users are encouraged to watch the detailed setup videos linked below for step-by-step guidance.
Zerodha Setup Video
AngelOne Setup Video
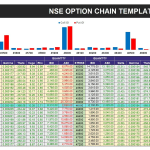
NSE Option Chain Template
NSE Option Chain is designed to provide a straightforward view of the options market for a particular stock listed on the National Stock Exchange of India. It centralizes critical options data in an easy-to-read format, ideal for traders who require quick and accurate information.
Key Features:
1. Option Interest Visualization: Includes open
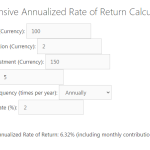
Annualized Rate of Return Calculator (CAGR)
by admin
Table of ContentsWhat is Annualized Rate of Return?What is CAGR?What is the difference between Annualized Rate of Return and CAGR?CalculatorSummary
Understanding the profitability of your investments can be complex. Enter the Annualized Rate of Return Calculator, providing a clear, user-friendly way to calculate the Compound Annual Growth Rate (CAGR) of your investment portfolio. Dive into the dynamics of Annualized Rate of Return and CAGR with this comprehensive guide!
What is Annualized Rate of Return?
Annualized rate of return is a financial term. It's used to measure profitability or growth over a year. For example, if you invest $100 and after one year it becomes $110, your annualized return is 10%. It isn't reliant on the investment period length. Even if your investment grows in six months, annualized rate of return still calculates the amount you'd get in a year. This rate is crucial as it helps investors compare different investment opportunities.
What is CAGR?
Annualized Rate of Return is a significant financial measure that shows the average yearly gain or loss on an investment. It expresses the profit or loss as a percentage that would have been made if the profit or loss were constant over the year. CAGR, or Compound Annual Growth Rate, is another important metric. It represents the mean annual growth rate of an investment over a specified period, longer than one year. CAGR smooths out the effects of volatility and gives a clearer picture of an investment's performance.
What is the difference between Annualized Rate of Return and CAGR?
Annualized Rate of Return and Compound Annual Growth Rate (CAGR) both measure investment growth. However, they are calculated differently. The Annualized Rate of Return is the geometric average amount of money an investment generates each year over a given time period. It considers the return over multiple periods. On the other hand, CAGR is the mean annual growth rate over a period longer than
- Previous 1/48
- Next